How Big is the Global Stock Market Declines in Local Currency Terms: Disparity between financial markets and the healthcare situation
A very short piece to put
in perspective the stock market correction globally. All data is from Bloomberg
website.


Here are the observations..
General Points:
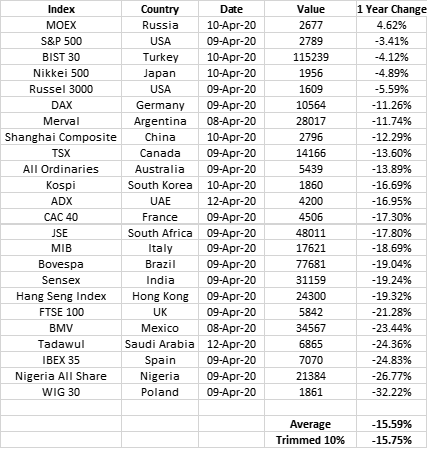
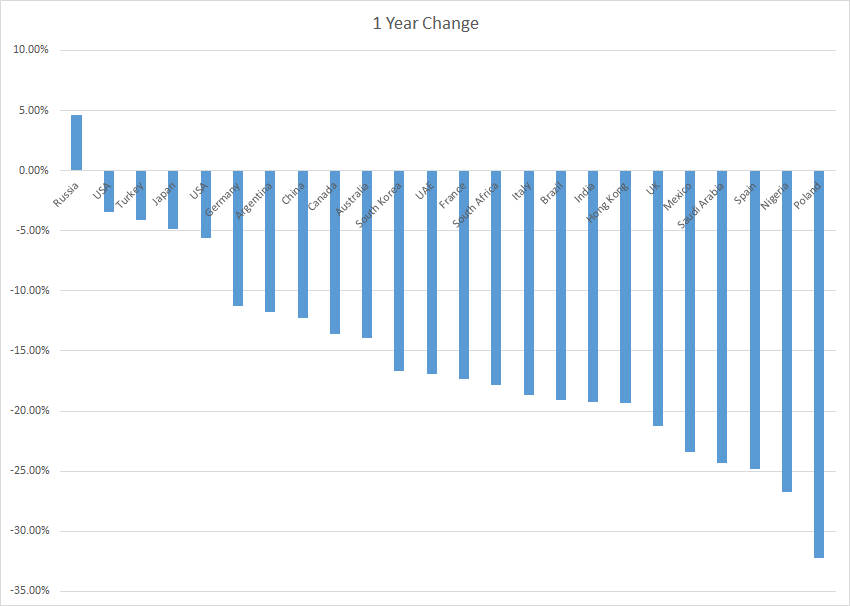
• 12 month global decline average of the markets listed above is only 15.6%.
• Declines from highs in the last 12 months are higher but in retrospective a fall of 15.6% over 12 months globally is not in line with a doom and gloom scenario.
• However as the real economy is undergoing severe problems caused by the healthcare crisis caused jointly by the virus and the public response, financial markets seem to have decoupled from the problem.
• The best indicator is S&P 500 which is down by only a 3.4% from a year ago.
Virus Hot Points:
• USA is beating the global average by a big margin.
• The origination point China is better by 3%.
• Italy, Spain and the UK are each underperforming by 3%, 9% and 6% net negative difference.
Other Comments:
• Emerging Market performance is all over the map with different performances.
• There are more outliers on the better performance side which are chiefly Russia, USA, Turkey and Japan.
• If currency effects are factored in, due to US Dollar strength most other markets would have fared worse and some significantly worse in USD terms.
Overall even though and even if in local currency 15.59% decline is big; it just is not at the moment a global crash in local currency terms.
April 2020


No comments:
Post a Comment